
Data Analytics Tools Optimize Your Business Decisions
Tool selection Business Intelligence or the right data analysis tools can increase efficiency in analyzing data and generate valuable knowledge. In this discussion us will provide a list of tools that can help optimize your business decisions.
Here's an in-depth review of five leading BI tools:
1. Tools Business Intelligence
a. Tableau
is one of the leading data visualization tools that offers an intuitive interface for creating interactive dashboards and complex data visualizations. Tableau supports a wide range of data sources and has a large community of users.
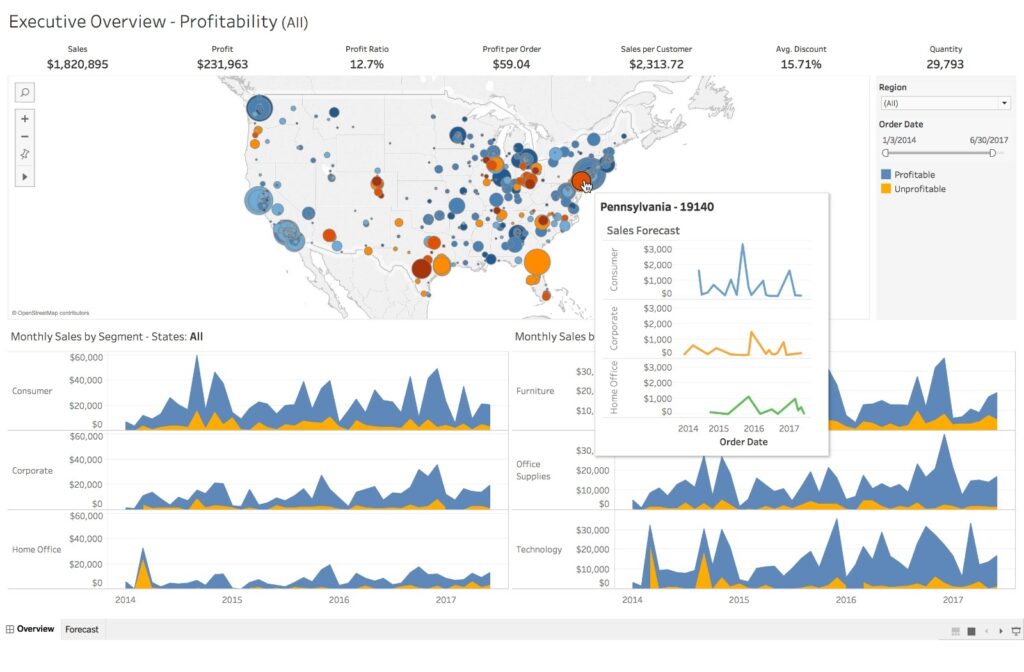
Image failed to load
Tableau
b. Power BI
is a powerful BI tool with deep integration with other Microsoft products such as Excel and Azure. Power BI offers a wide range of powerful data analytics and visualization features at a competitive price.
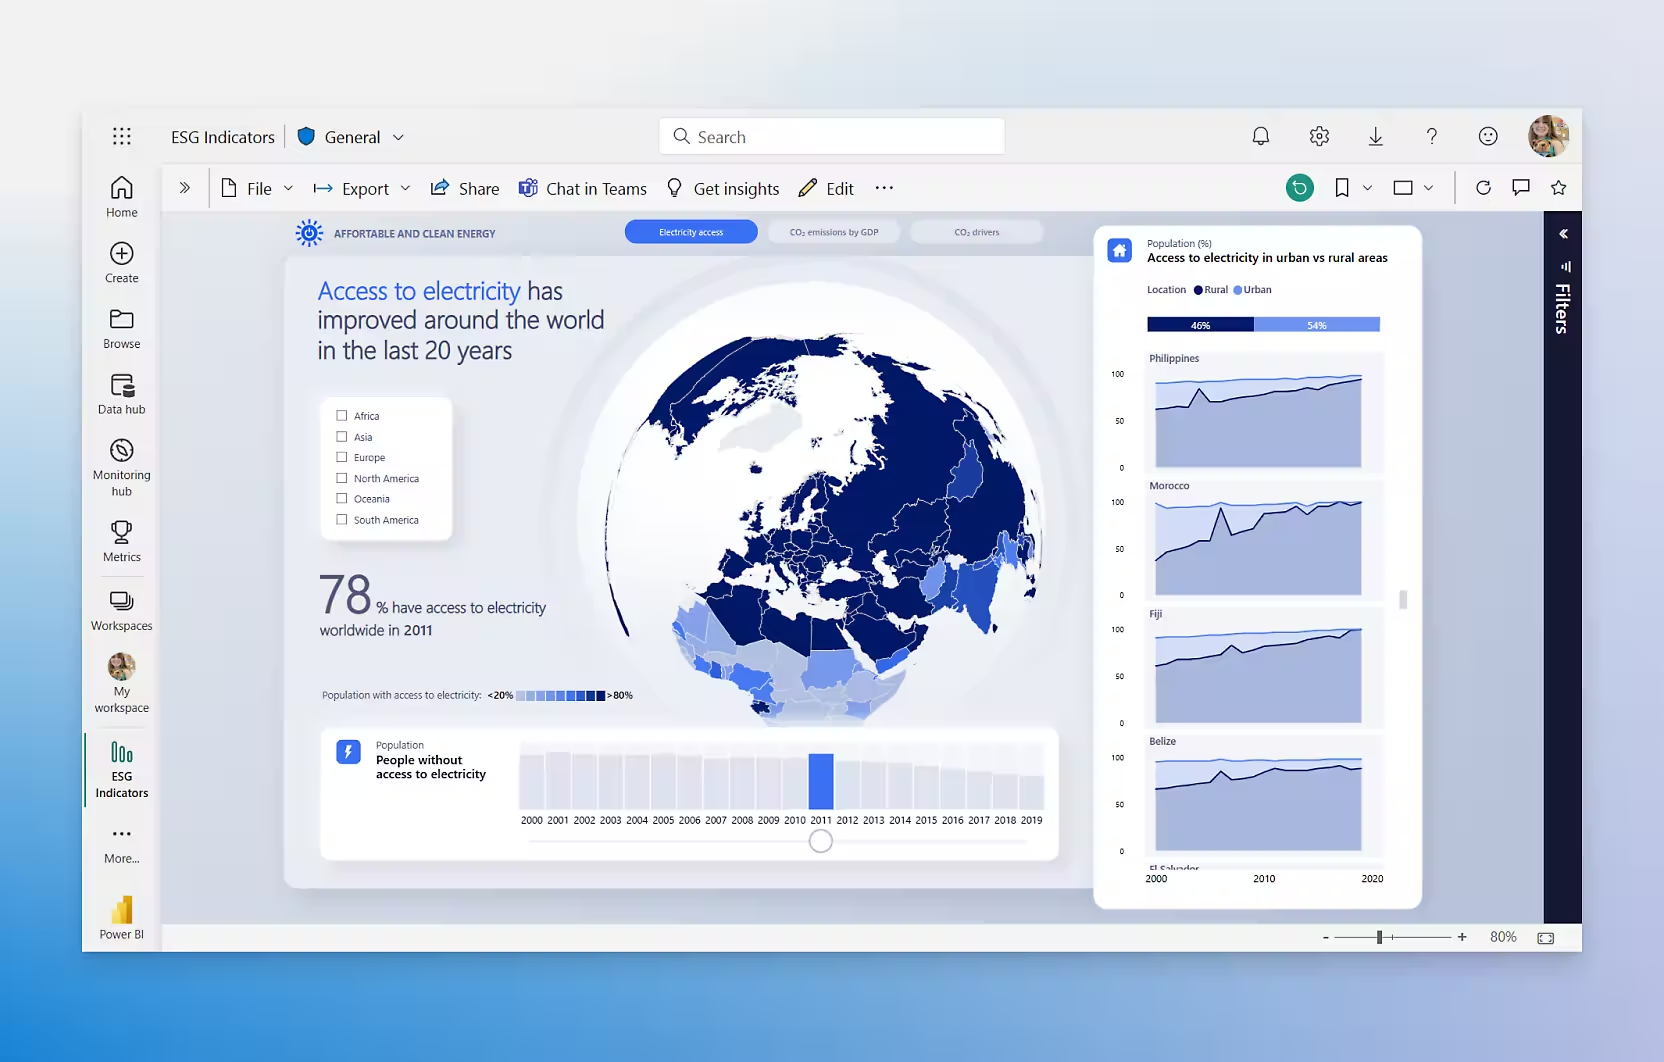
Power BI
c. Google Looker Studio
Google Looker Studio is a free tool that allows users to easily create customizable reports and dashboards. Strong integration with other Google products such as Google Analytics and BigQuery is its main advantage.
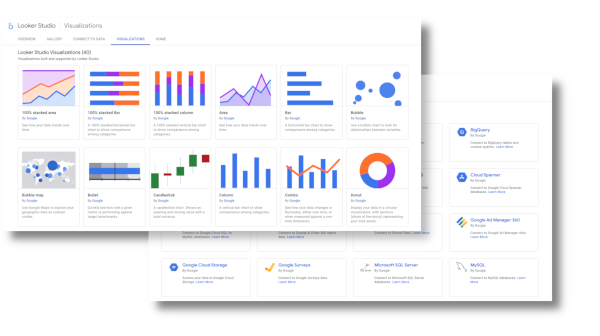
Image failed to load
Looker Studio
d. Grafana
Grafana awalnya dikembangkan untuk memantau metrik dan log, terutama dalam konteks DevOps dan pengembangan perangkat lunak. Namun, Grafana juga mendukung berbagai sumber data dan dapat digunakan untuk visualisasi data secara umum.

Image failed to load
Grafana
e. Apache Superset
Apache Superset is an open-source BI tool developed by Apache. Superset offers powerful data visualization capabilities and support for a wide range of databases through SQLAlchemy.
Apache Superset
3. Comparative Analysis
a. Fitur
| Fitur | Tableau | Power BI | Google Looker Studio | Grafana | Apache Superset |
|---|---|---|---|---|---|
| Visualisasi | Very powerful with different chart types | Powerful with Microsoft integration | Pretty good with customization options | Focus on metrics and real-time | Flexible with support for multiple charts |
| Integrasi Data | More than 100 connectors | Deep integration with Microsoft products | Powerful integration with Google products | Support for multiple data sources | Mendukung berbagai database via SQLAlchemy |
| Dashboard | Interaktif dan dinamis | Interaktif dengan kemampuan drill-down | Mudah dibagikan dan kolaboratif | Fokus pada monitoring real-time | Interactive and customizable |
| Analitik | Advanced analytics with Tableau Prep | DAX for in-depth analysis | Basic analytics features | Real-time analytics | SQL-based analytics |
b. Ease of Use
- Tableau: Intuitive drag-and-drop interface, suitable for both business and technical users.
- Power BI: Familiar to Microsoft users with easy Excel integration.
- Google Looker Studio: Very easy to use, especially for users who are familiar with Google products.
- Grafana: Higher learning curve, especially for configuration and setup of data sources.
- Apache Superset: Requires more technical knowledge, especially in terms of setup and maintenance.
c. Price
- Tableau: Prices are relatively high, with per-user licenses varying depending on features.
- Power BI: More affordable, with free and paid options starting at $9.99 per user/month.
- Google Looker Studio: Free to use with basic features.
- Grafana: Free open-source, with paid options for enterprise features.
- Apache Superset: Open-source and free, but requires resources for management.
d. Integrasi dan Konektivitas
- Tableau: Supports more than 100 data connectors, including cloud and on-premises.
- Power BI: Strong integration with the Microsoft ecosystem and various cloud services.
- Google Looker Studio: Natively integrated with Google products such as Google Analytics, Google Ads, and BigQuery.
- Grafana: Supports a wide range of data sources such as Prometheus, Elasticsearch, MySQL, PostgreSQL, and more.
- Apache Superset: Extensive support for a wide range of databases through SQLAlchemy, including PostgreSQL, MySQL, and more.
e. Kinerja dan Skalabilitas
- Tableau: Dapat menangani volume data besar dengan kinerja yang baik, namun memerlukan sumber daya yang cukup.
- Power BI: Skalabilitas baik dengan opsi cloud Power BI Service, cocok untuk berbagai ukuran organisasi.
- Google Looker Studio: Baik untuk volume data kecil hingga menengah, dengan batasan pada sumber data tertentu.
- Grafana: Excellent for real-time data and monitoring, but may require optimization for large volumes of data.
- Apache Superset: Skalabilitas tergantung pada infrastruktur yang digunakan, cocok untuk organisasi yang memiliki tim teknis.
f. Dukungan dan Komunitas
- Tableau: Large user community, many learning resources and official support.
- Power BI: Official support from Microsoft and an active community.
- Google Looker Studio: A growing community with support from Google.
- Grafana: Komunitas open-source yang aktif dan banyak plugin tambahan.
- Apache Superset: An open-source community that is constantly growing, but may be less resourceful than commercial tools.
g. Keamanan
- Tableau: Enterprise-grade security features, including role-based access control and data encryption.
- Power BI: Enterprise-grade security with Azure Active Directory integration, data encryption, and industry-standard compliance.
- Google Looker Studio: Security managed by Google, with Google account-based access control.
- Grafana: Security features are configurable, including authentication and authorization, but require manual setup.
- Apache Superset: Security depends on the configuration and infrastructure used, including authentication and access control.
4. Suitable Use Case for Each Tool
a. Tableau
- Sales and Marketing Analysis: Create interactive dashboards to track sales performance, marketing campaigns, and customer behavior.
- Finance and Accounting: Financial data visualization, budget reports, and profitability analysis.
- Human Resources: Analyze employee data, retention, and team performance.
- Operations and Logistics: Monitor operational efficiency, supply chain, and inventory management.
- Healthcare: Analyze patient data, hospital performance, and public health trends.
b. Power BI
- Integration with the Microsoft Ecosystem: Suitable for organizations using Microsoft Office 365, Azure, and Dynamics 365.
- Financial Reporting: Create in-depth financial reports with Excel integration and DAX analysis capabilities.
- Project Management Dashboard: Track project progress, resource allocation, and team performance.
- Sales Analytics: Analyze real-time sales, target, and product performance data.
- Business Performance Monitoring: Create KPIs and business metrics that can be monitored on an ongoing basis.
c. Google Data Studio
- Digital Marketing Report: Direct integration with Google Analytics, Google Ads, and YouTube to track the performance of digital campaigns.
- Social Media Dashboard: Collect data from various social media platforms for engagement and reach analysis.
- Pelaporan Website: Generate website performance reports, including traffic, conversions, and user behavior.
- Analisis SEO: Combining data from various sources to analyze SEO performance and content strategy.
- Kolaborasi Tim: Create dashboards that are easy to share and access for different teams in your organization.
d. Grafana
- IT Infrastructure Monitoring: Monitor servers, networks, and applications in real-time to ensure optimal performance.
- DevOps and Software Development: Track your app's build, deployment, and performance metrics.
- Internet of Things (IoT): Visualization of data from IoT devices for real-time analysis and predictive maintenance.
- Security and Log Management: Analyze security logs and detect anomalies in the system.
- Real-Time Analytics: Create dashboards that display data directly for quick decision-making.
e. Apache Superset
- Big Data Analytics: Manage and analyze large volumes of data with the flexibility of SQL.
- Custom Dashboard Development: Create a dashboard tailored to the specific needs of the organization.
- Integration with Various Databases: Suitable for organizations that use different types of databases and require unified visualization.
- Data Exploration: Allows users to interactively explore data and discover insights without the need for formal reporting.
- Internal Web Application: Integrate Superset into internal web applications to provide users with data access and visualizations.
5. Advantages and Disadvantages of Each
#a. Tableau
Excess:
- Highly powerful and interactive data visualizations.
- Lots of data connectors and extensive integrations.
- A large user community and abundant learning resources.
Deficiency:
- Relatively high price.
- Requires training to take advantage of advanced features.
b. Power BI
Excess:
- Affordable pricing with free options.
- Deep integration with Microsoft products.
- Powerful analytics features with DAX.
Deficiency:
- Learning curve for advanced features.
- Some limitations in visual customization compared to Tableau.
c. Google Looker Studio
Excess:
- Free to use.
- Easy to integrate with other Google products.
- Simple and easy-to-understand user interface.
Deficiency:
- More limited analytics and visualization features.
- Less suitable for complex data analysis.
d. Grafana
Excess:
- Excellent for real-time data monitoring.
- Open-source and flexible with many plugins.
- Support for multiple data sources.
Deficiency:
- The learning curve is higher.
- Not optimal for complex business data analysis.
e. Apache Superset
Excess:
- Open-source and free.
- Support for various databases via SQLAlchemy.
- Flexible and customizable visualizations.
Deficiency:
- Requires a technical team for setup and maintenance.
- Security and support features may be lacking compared to commercial tools.
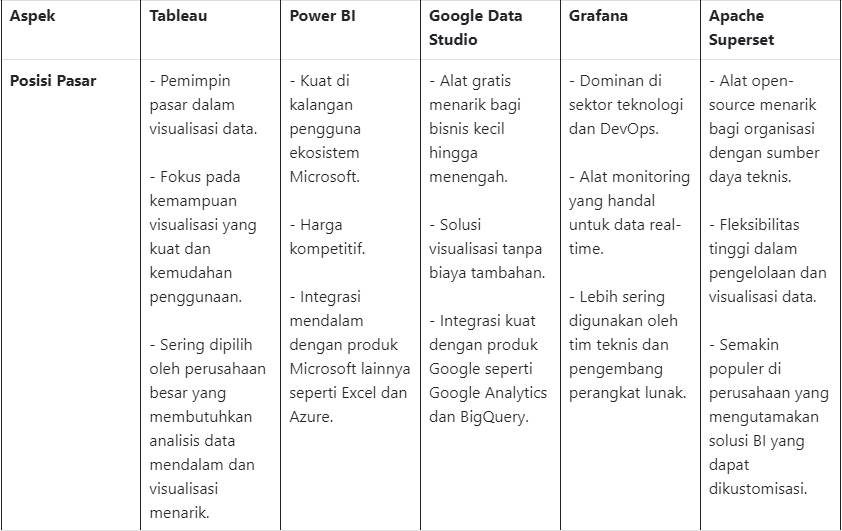
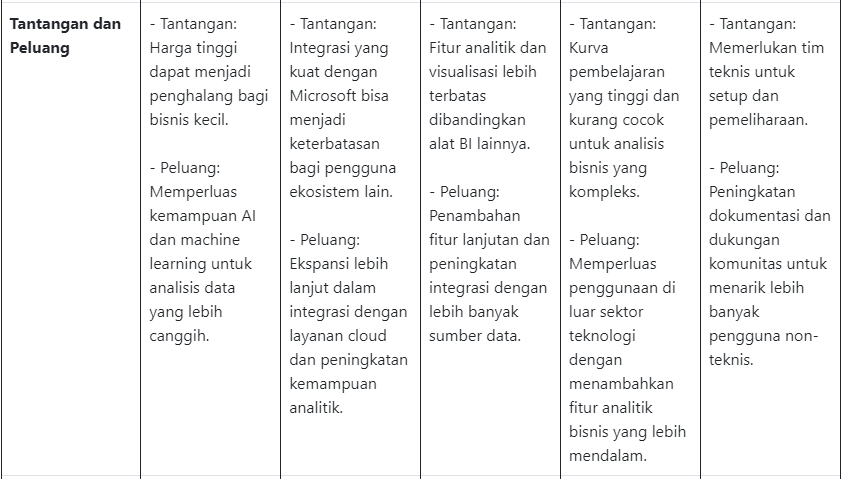
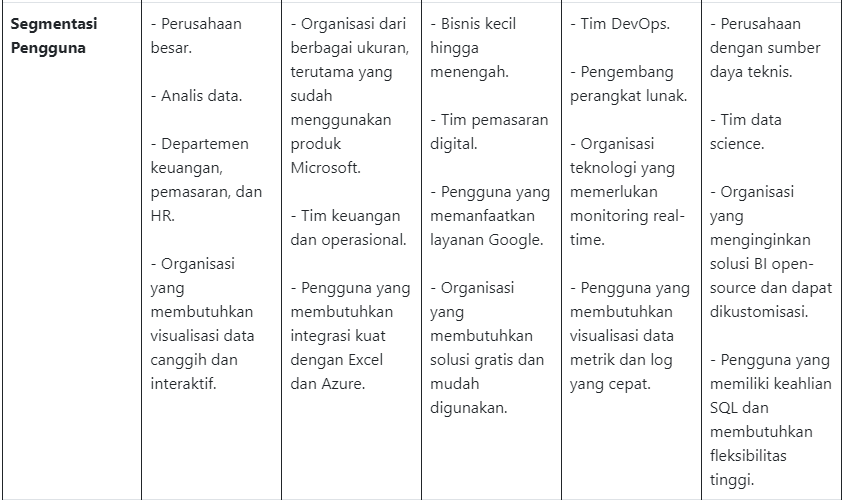
6. Competitive Landscape

7. Conclusion and Recommendations
Choosing the right BI tool depends on the specific needs of the organization, budget, and available resources. Here are some recommendations based on the scenario:
- If you need a very powerful data visualization and are ready to invest, Tableau is a good choice.
- If you're already in the Microsoft ecosystem and looking for an affordable solution, Power BI is the ideal option.
- If you're looking for a free tool with powerful integration into Google products, Google Looker Studio is for you.
- If your focus is on real-time data monitoring and has a technical team, Grafana could be the right choice.
- If you are looking for an open-source tool with high flexibility and technical capabilities, Apache Superset is a good alternative.
From the perspective of its function, then the recommendations that can be given:
- If the system manages data points that are large, varied, unaffiliated (integrated) with other tools and there is a division/team of professional data analysts, it is recommended to use Tableau because of its huge features and community
- If the system manages data points that are large, varied, affiliated (integrated) with other tools such as Microsoft / Google ecosystem and there is a division/team of data analysts, it is recommended to use Power BI or Google Looker Studio because it will simplify and speed up the process of creating dashboards with direct data integration
- If the system requires real-time information and has a technical team, then grafana and apache superset are the main choices. In addition to being open-source, grafana and apache have direct integration support into databases/sql queries that speed up the process of creating real-time dashboards.
The conclusion from the tools above, can be categorized into two, namely:
Dashboards for analytics data exploration: Tableau, Power BI and Google Looker Studio
If you need in-depth data analysis and cost isn't an issue: Tableau
If you need small, vertical analytics and third-party integrations: Power BI and Looker Studio can be a consideration
Dashboard for real-time information visualization: Grafana, Apache Superset
From the two categories it can be used to perform different functions.


 Have any question?